 Overview
Terje Aasland
Minister of Energy
“Mission Innovation 2.0 holds great promise for future co-operation on development and market introduction of clean energy technologies. Norway has a lot to contribute, in particular, in carbon capture and storage, clean shipping, hydrogen solutions and floating wind power. We look forward to learning from other members and teaming up to achieve common objectives to help fulfil the goals of the Paris Agreement.”
Senior Representative
Mr. William Christensen
Deputy Director General, Norwegian Ministry of Energy
Role in Mission Innovation
- Member of Technical Advisory Group
- Co-leads the Zero-Emissions Shipping Mission
- Member of the Clean Hydrogen Mission
News & Events
- [June 2, 2021] Norway joins Mission Innovation members in launching MI2.0 and a decade of clean energy innovation to accelerate achieving the Paris Agreement Goals
- Norway celebrates Mission Innovation’s 5-year anniversary
Participation in MI’s first phase
- Participated in the:
- Smart Grids Innovation Challenge
- Off-Grid Access to Electricity Innovation Challenge
- Carbon Capture Innovation Challenge
- Sustainable Biofuels Innovation Challenge
- Converting Sunlight Innovation Challenge
- Clean Energy Materials Innovation Challenge
- Affordable Heating and Cooling of Buildings Innovation Challenge
- Renewable and Clean Hydrogen Innovation Challenge
Resources:
- (First phase) PLANS AND PRIORITIES
- HIGHLIGHTS IN 2017
- HIGHLIGHTS IN 2018
- HIGHLIGHTS IN 2019
- (First phase) INNOVATION BREAKTHROUGHS
Clean Energy Innovation investment (MI 1.0)
Country-determined baseline year(s): 2013-2015
Baseline funding amount: NOK 1.132 billion (USD $140 million)
Doubling target year: 2020
Doubling target amount: NOK 2.265 billion (USD $280 million)
Find out more about how Norway’s baseline and doubling are calculated
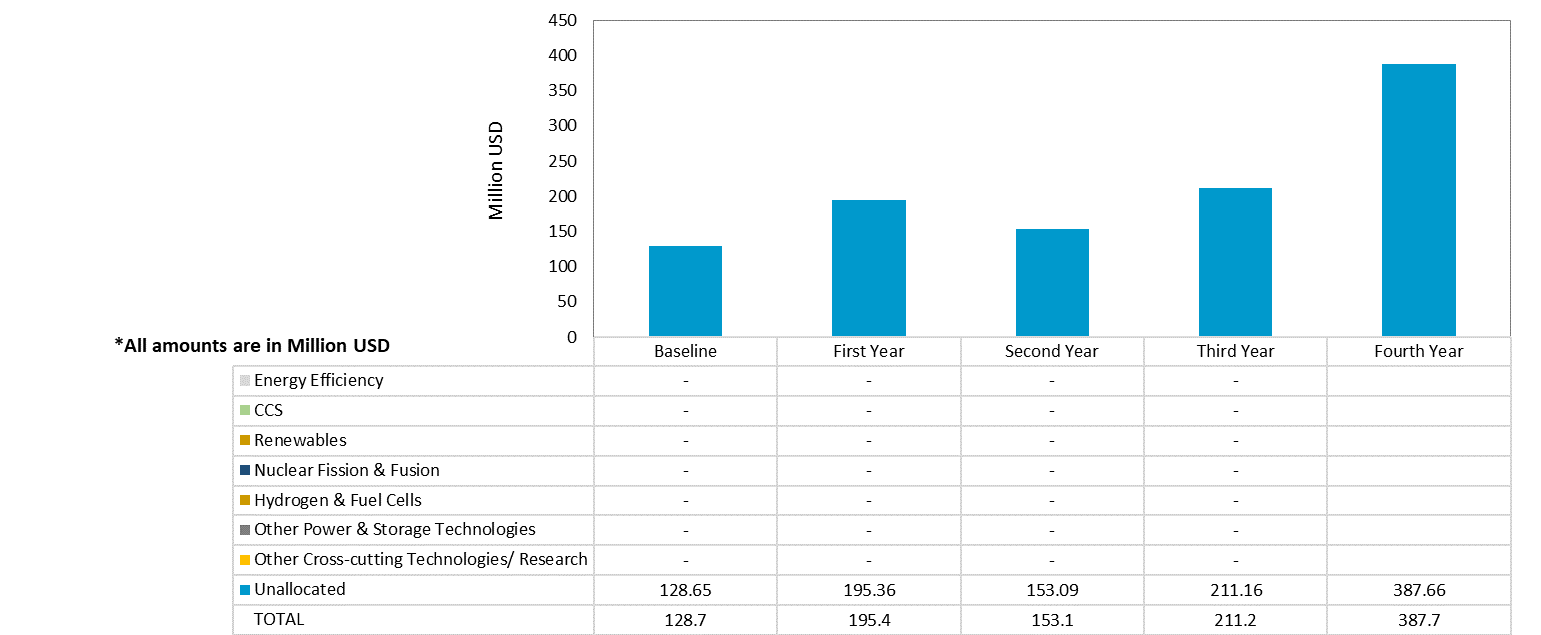
*Figures in the spending chart are based on USD exchange rates in 2020